A machine under load moves along a coupled thermal, mechanical, and electrical trajectory. We propose nine scalar descriptors — atoms — computed from the joint trajectory of every channel pair. Eight are built from within-unit ranks and are exactly invariant to any strictly monotone recalibration of each channel separately. The ninth, the signed Lévy area, captures the arrow of time and is the unique atom that changes sign under time reversal. On seven real industrial systems (309 records) the atlas identifies the source system at 99.4% accuracy (CI [97.7, 100.0]) against 96.1% for per-channel marginals. Under re-instrumentation the atlas holds at 99.0% while marginals fall to 80.3%. In controlled simulated fleets of 48 machines, an autoencoder trained on raw telemetry beats the atlas on clean data by 1.5× but collapses to chance under re-instrumentation; the atlas is numerically unchanged. The method requires a minimum of approximately 10³ samples per window and does not improve short-horizon forward prediction, where the identity is redundant with the state history. Its value is in identification, auditing, and transfer rather than in accuracy.
The idea: route on geometry, not on raw state
A servo joint accelerating a payload dissipates ohmic heat into a winding whose rising temperature derates the torque available to the next command — on a thermal time constant three decades slower than the control loop that issued it. Watch any one channel and you see a line wandering. Watch two against each other and you see a shape, and the shape is where the coupling lives.
Each channel pair gets nine atoms. The whole array over all pairs is one unit's atlas. Nine quantiles of each atom across pairs gives a signature of fixed length whatever the channel count — which is how a 12-channel motor and a 24-channel turbofan can be compared at all.
Spearman ρ
Monotone association. How strongly one channel tracks another, regardless of scale.
Distance correlation
Functional strength. Detects any dependence, linear or not. Zero iff independent.
Hoeffding D
Nonlinearity gap. How far the joint distribution deviates from independence.
Copula asymmetry
Whether dependence is stronger in one tail than the other.
Signed Lévy area
The arrow of time. Flips sign under time reversal. The one atom a correlation matrix cannot reach.
Jump share
Fraction of trajectory spent in jumps rather than smooth motion.
Timescale ratio
Power distribution across frequencies. Separates slow thermal drift from fast oscillation.
Support occupancy
How much of the rank-plane the trajectory actually visits.
Scaling exponent
Hurst-like. Whether the trajectory is persistent, anti-persistent, or a random walk.
Recalibration invariance is exact
Replace a sensor, rescale a channel, apply any strictly increasing warp to each channel independently: the atlas does not move. This is not a trained property — it follows from the construction. Eight of nine atoms are computed on within-unit ranks, and monotone transforms preserve ranks exactly. Verified to machine precision (0.00×10⁰ change) on all three robotic platforms.
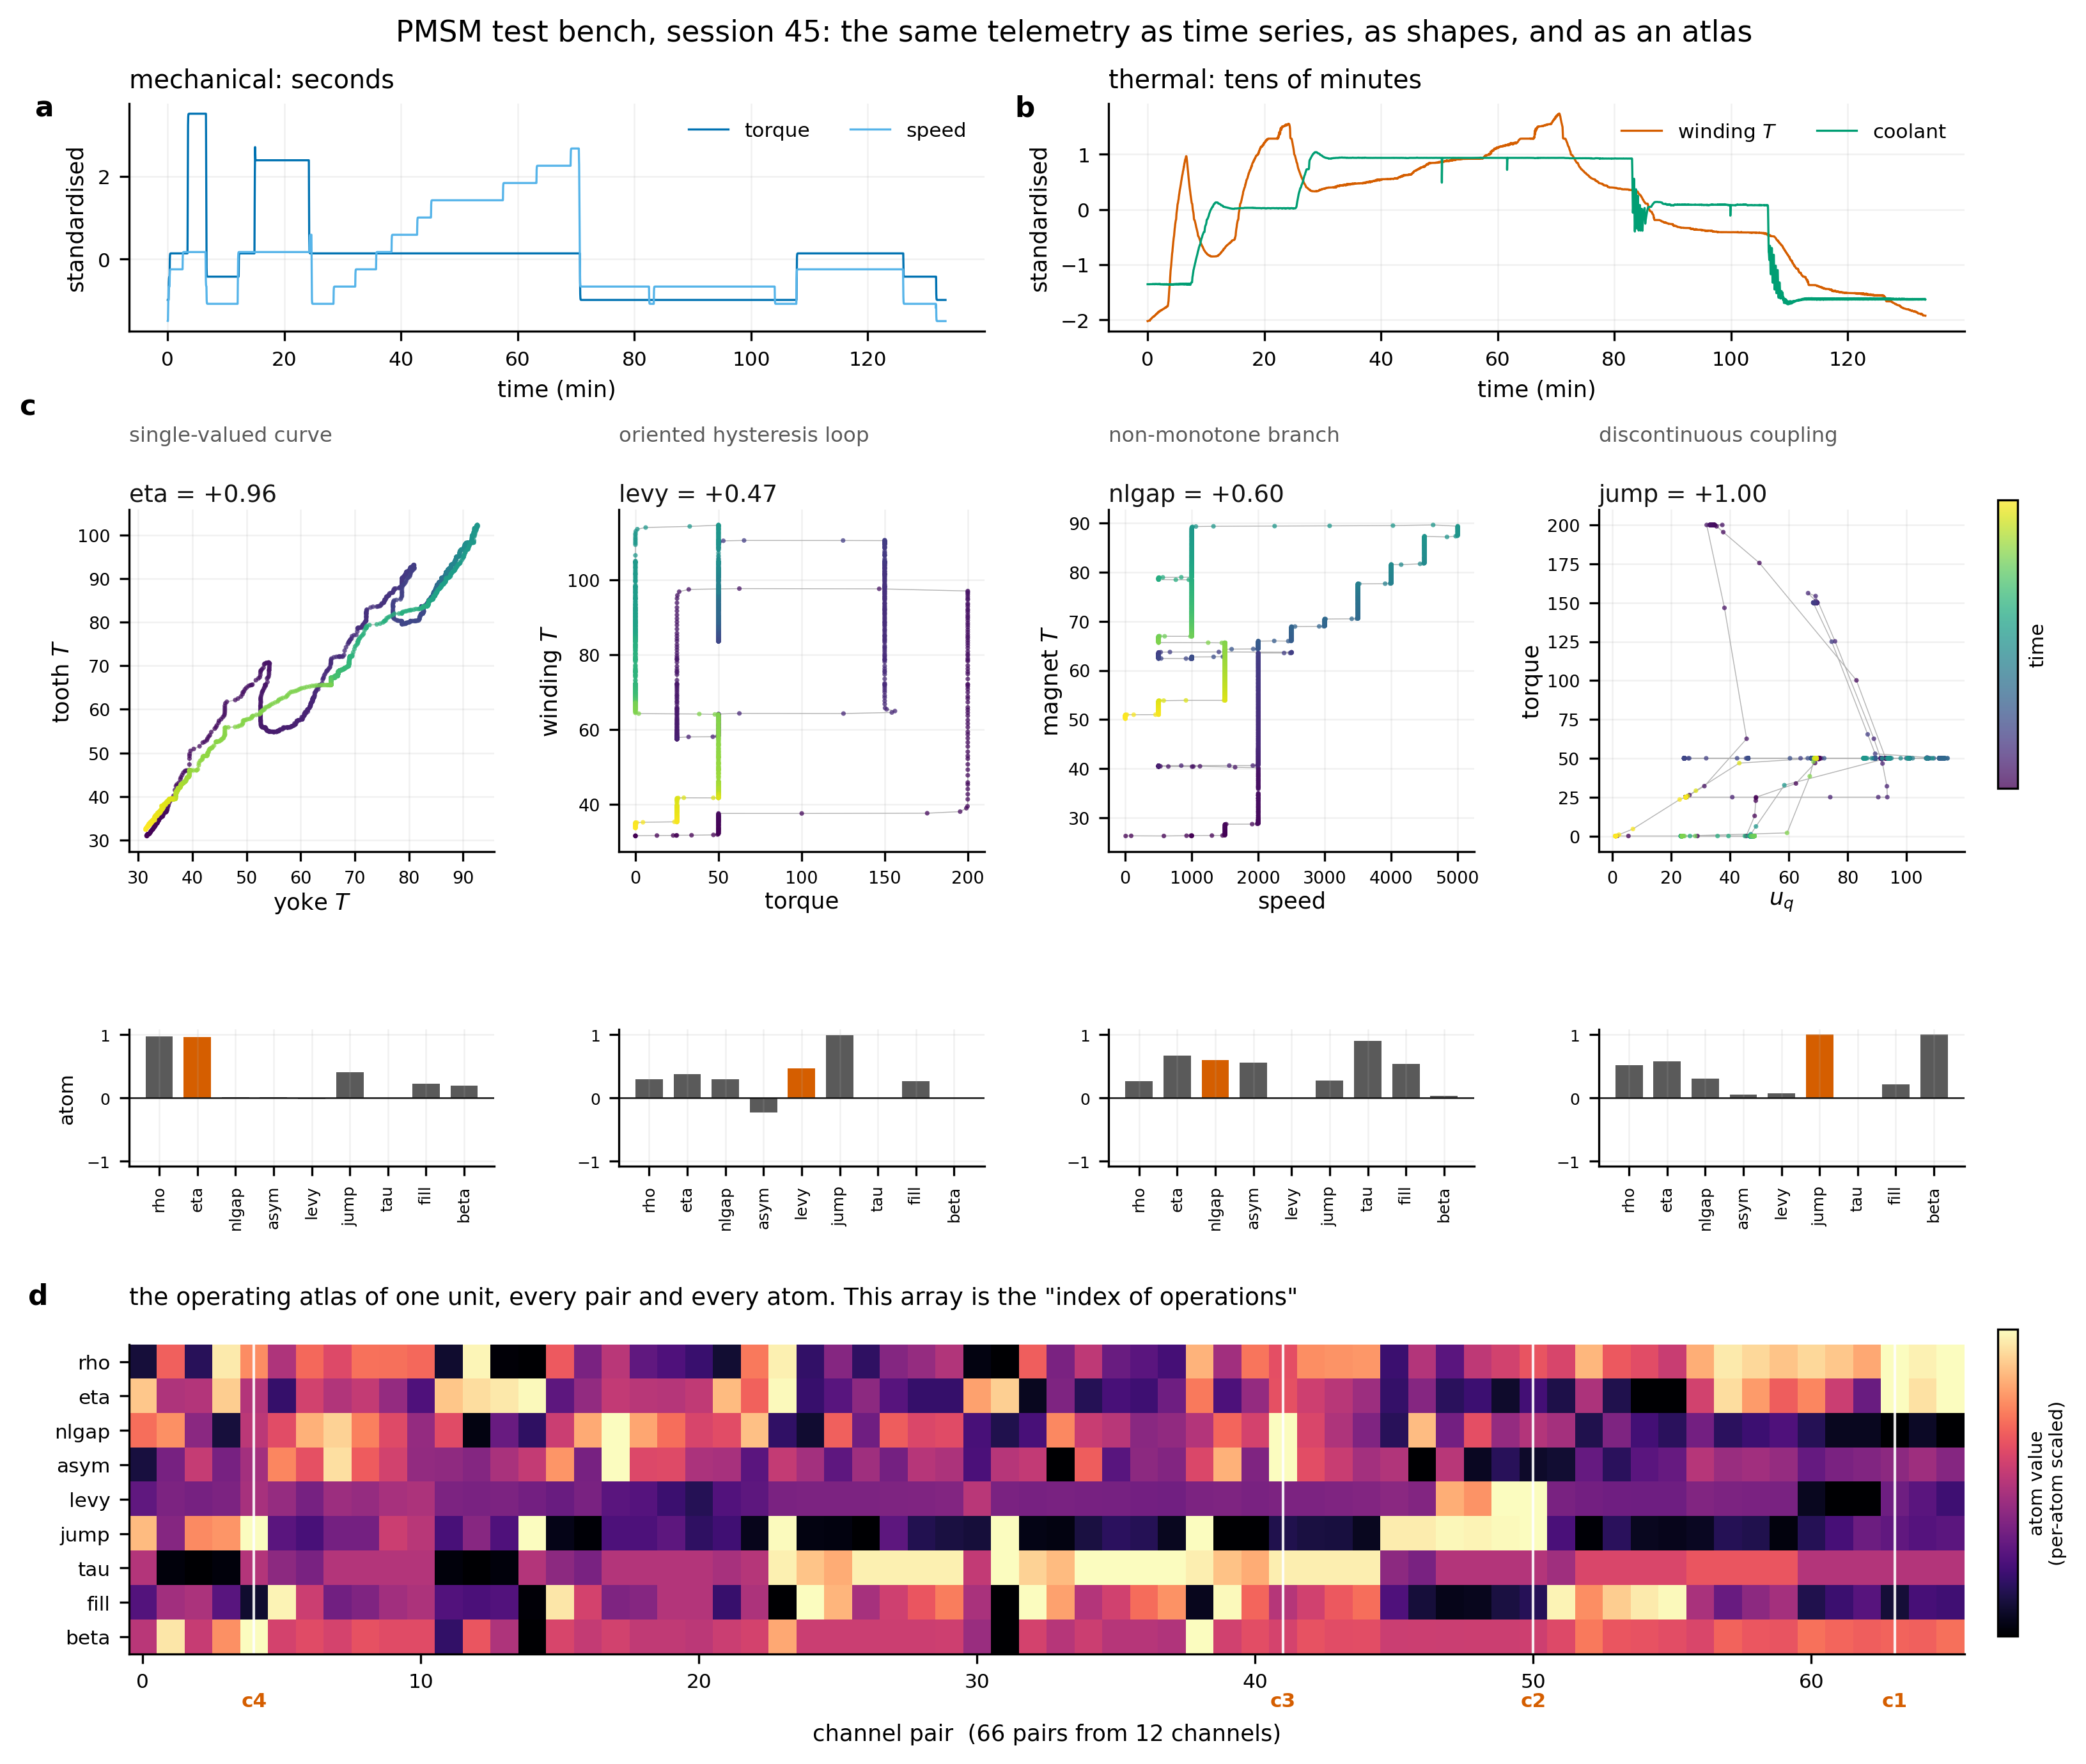
Four exemplar channel pairs showing different coupling geometries. The full atlas as a heatmap. Under monotone warp: unchanged to machine precision.
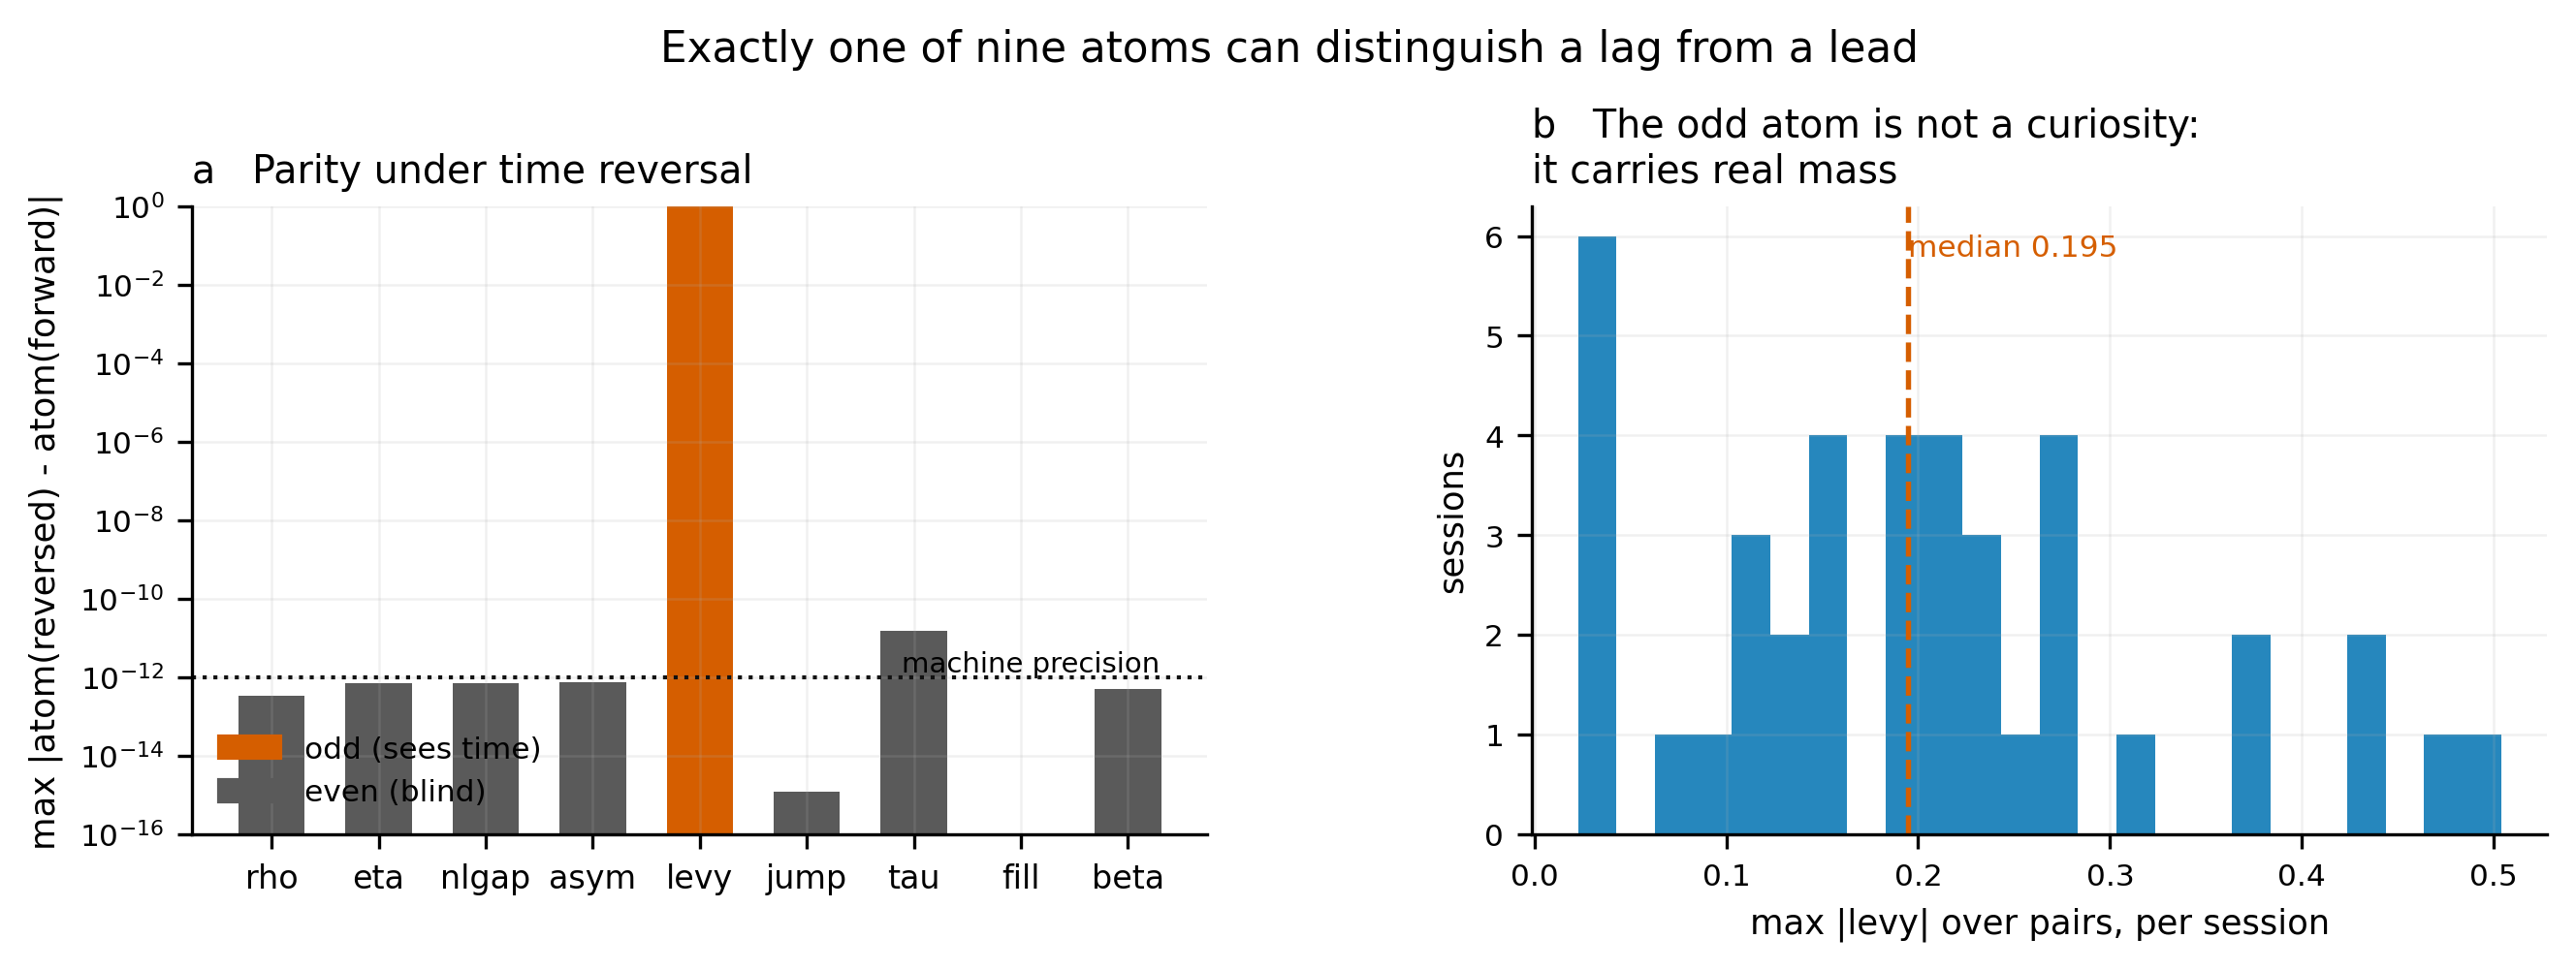
Eight atoms overlap perfectly after reversal (even sector). The Lévy area flips sign (odd sector) to 4.7×10⁻¹⁴.
Seven real industrial systems, 309 records
Nothing simulated except the recalibration warp. The atlas identifies which system a record came from at 99.4% against 96.1% for marginals and 86.4% for Spearman correlation. Under re-instrumentation: atlas 99.0% vs marginals 80.3%.
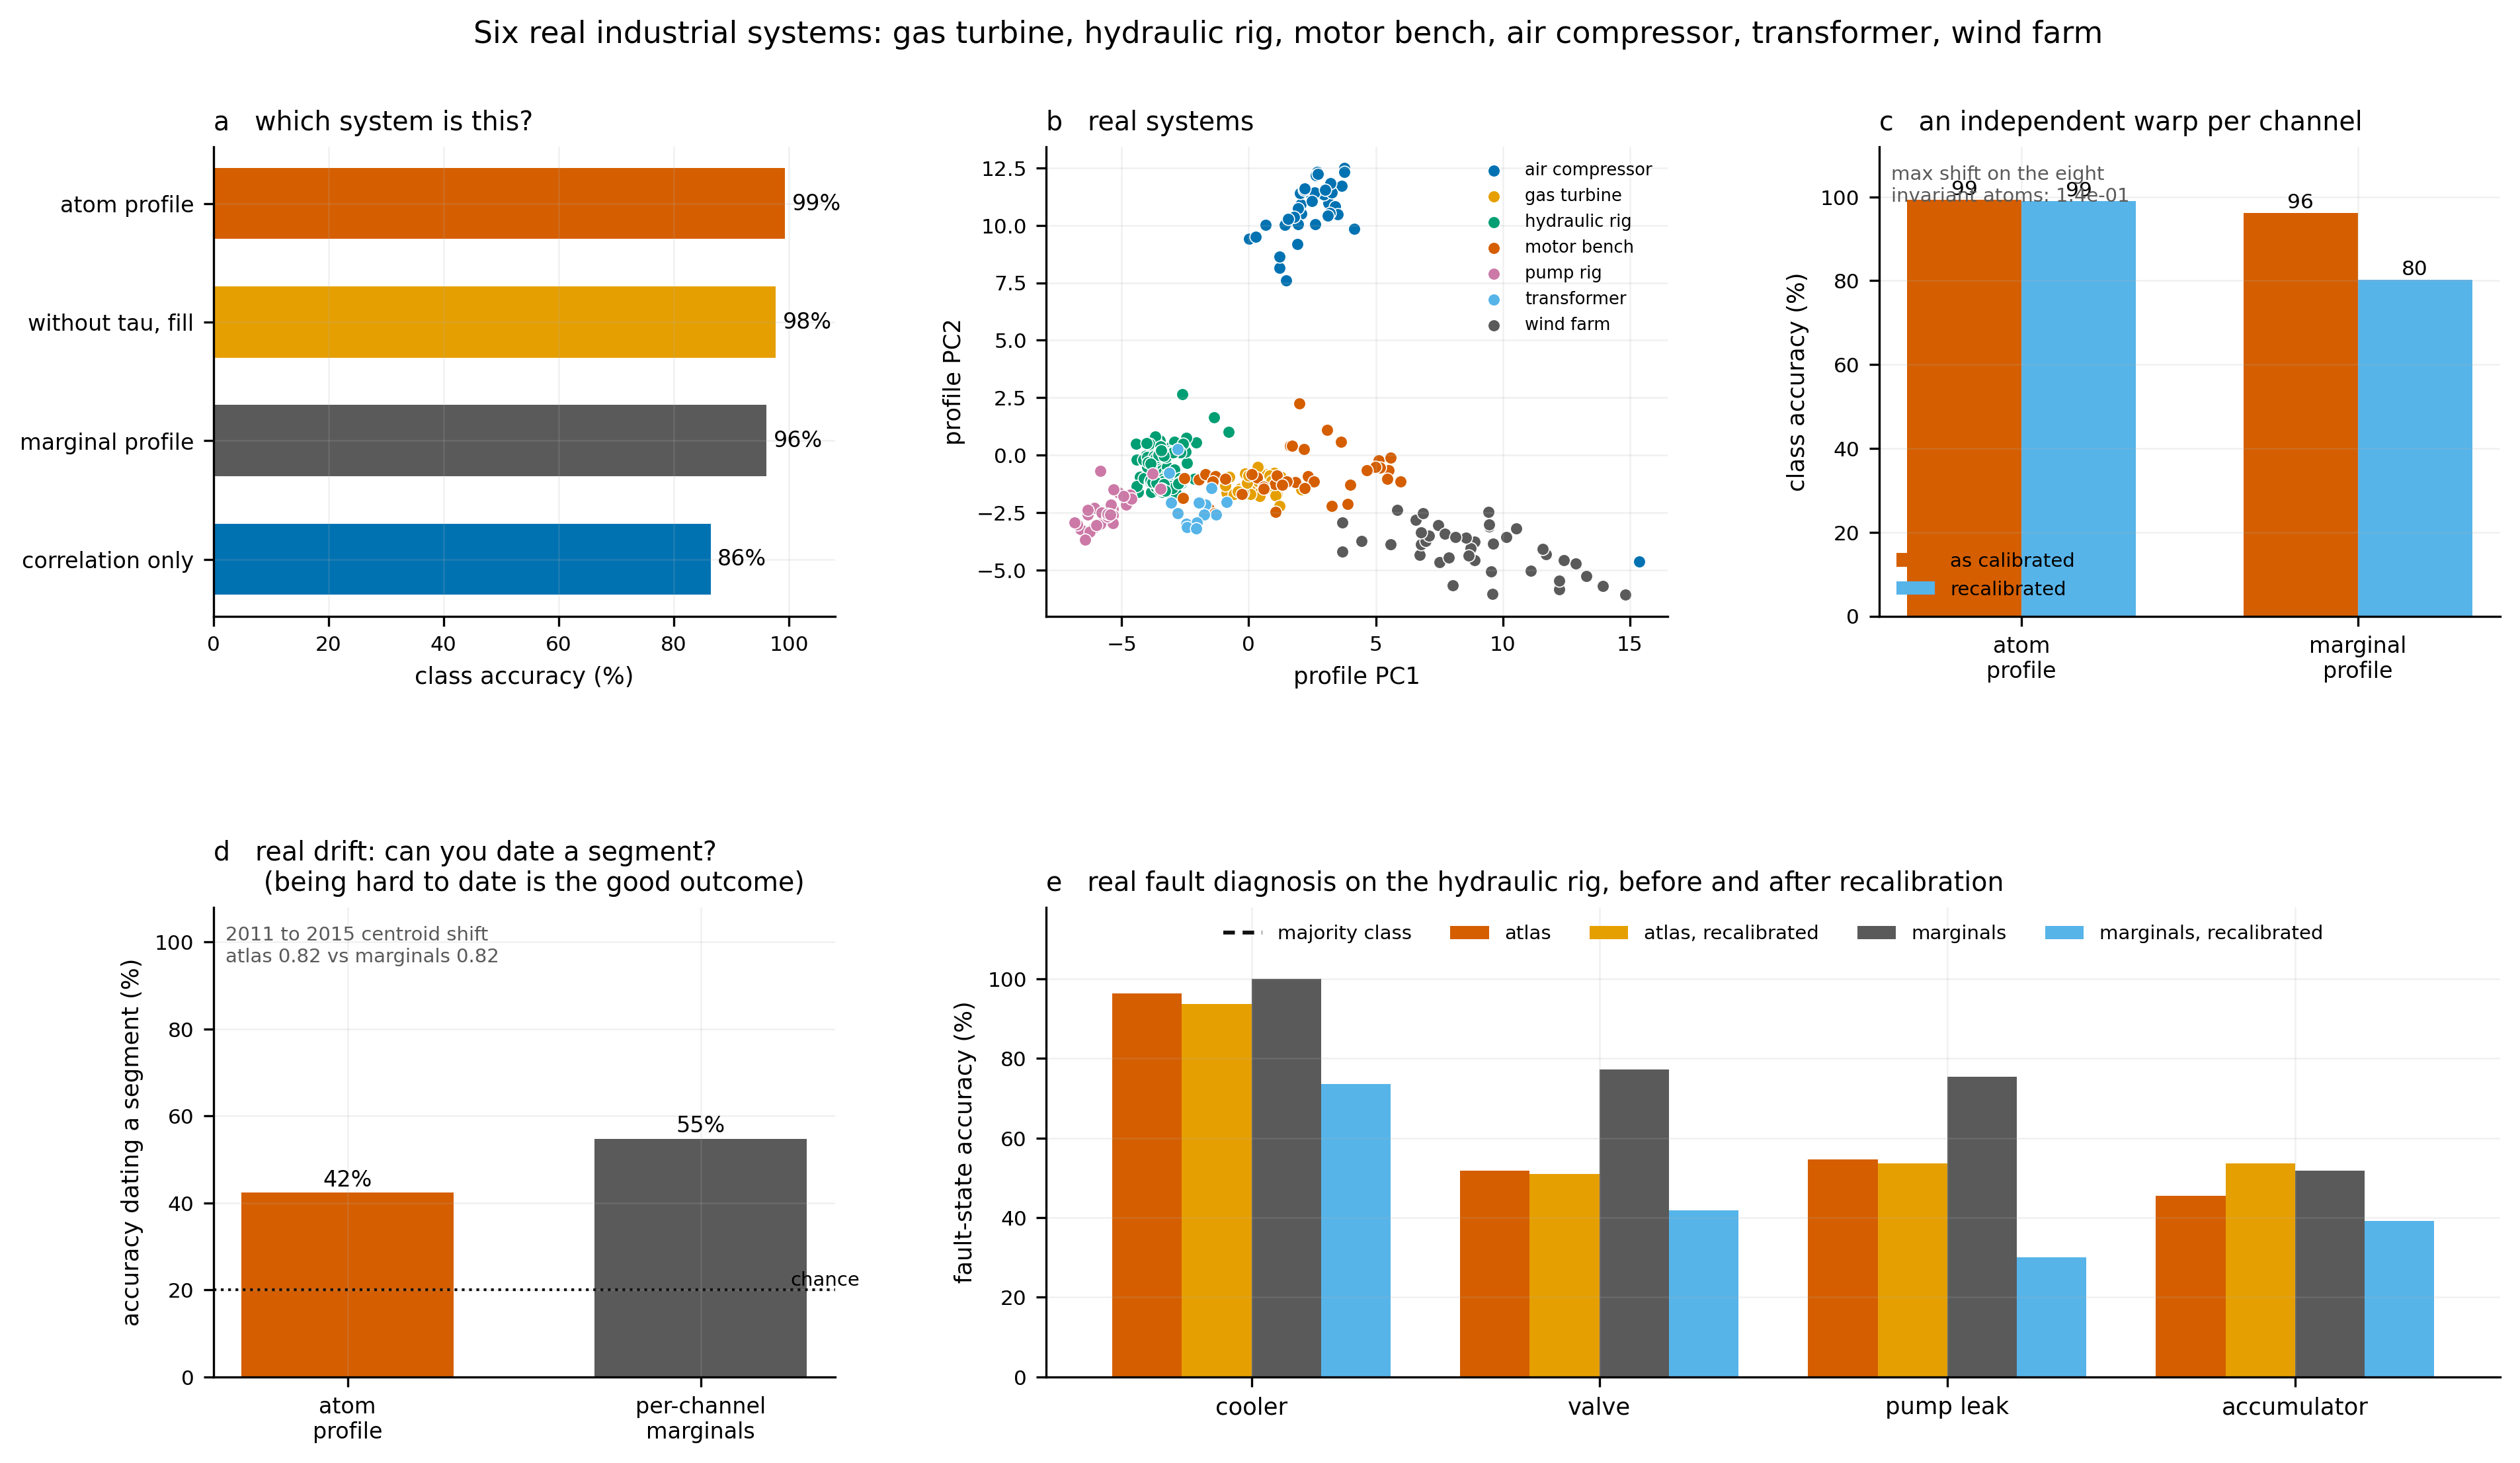
Atlas 99.4% (CI [97.7, 100.0]) vs marginals 96.1%. Under re-instrumentation: atlas 99.0% vs marginals 80.3%.
AE wins on clean data by 1.5×. Under warp: AE collapses to chance, atlas unchanged.
| Component | Atlas | Atlas CI | Marginals | Warp (atlas) | Warp (marginals) |
|---|---|---|---|---|---|
| Cooler | 96.4% | [89.7, 98.7] | 94.7% | 96.4% | 73.6% |
| Valve | 97.8% | [93.2, 99.5] | 98.9% | 97.8% | 82.1% |
| Pump | 73.6% | [62.8, 82.4] | 81.6% | 73.6% | 55.5% |
| Accumulator | 89.5% | [80.3, 95.1] | 90.4% | 89.5% | 68.4% |
The controlled fleet experiment
Simulated fleets of 48 machines per platform (UR5e, Panda, iiwa14), each with independent physical parameters. Three fleet types isolate the two axes of machine identity: level (magnitude only — atlas should fail), shape (coupling only — atlas should succeed), both.
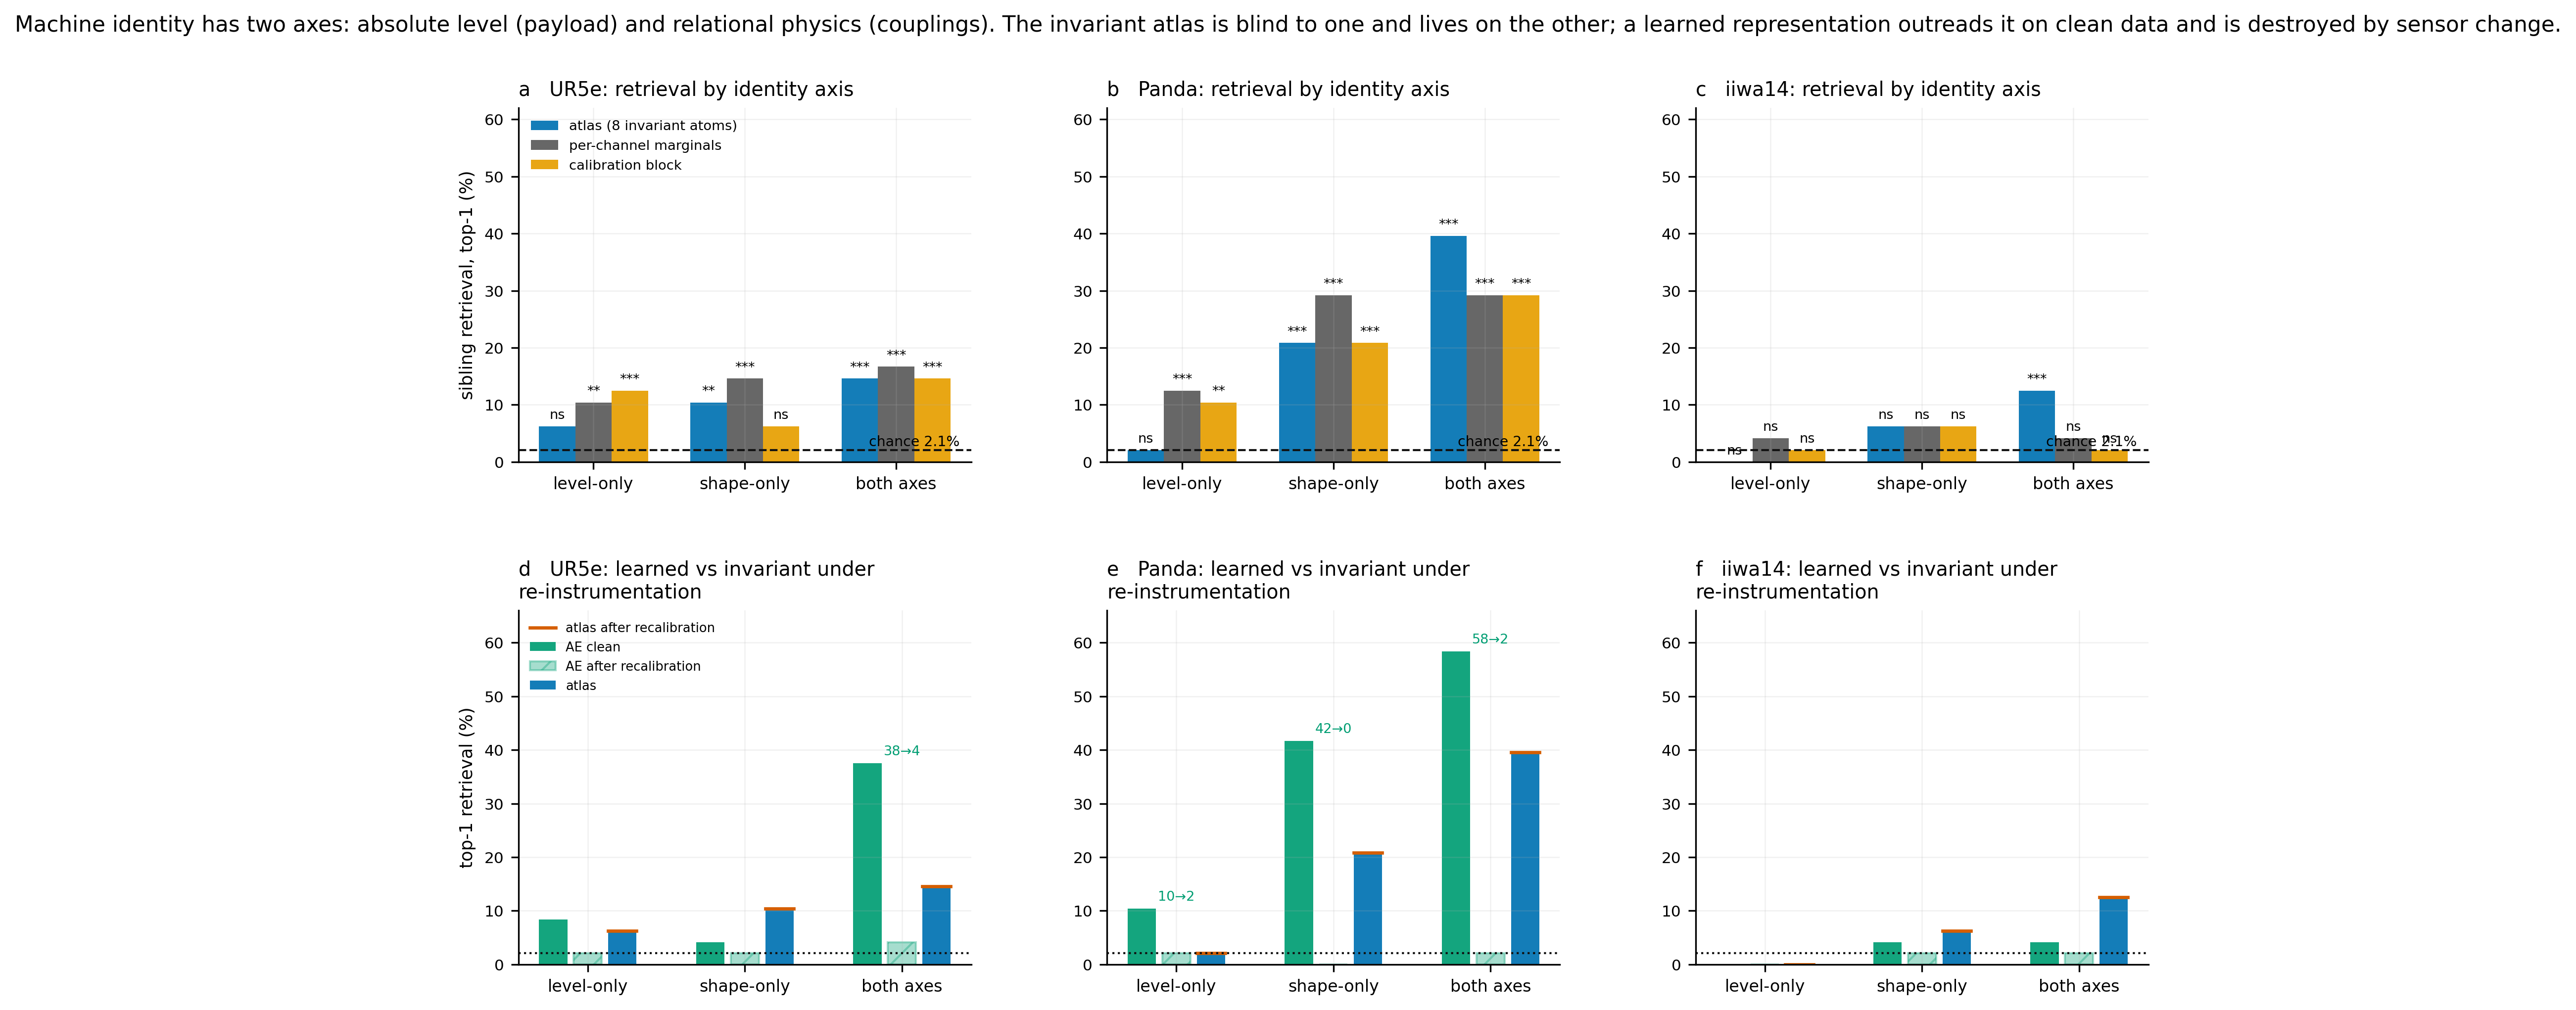
Atlas at chance on every level fleet. AE wins clean, collapses under warp. Atlas numerically identical before and after.
| Platform | Fleet | Atlas | Atlas warped | AE clean | AE warped |
|---|---|---|---|---|---|
| UR5e | level | 6.2% (ns) | 6.2% | 8.3% | 2.1% |
| UR5e | shape | 10.4% (p=.003) | 10.4% | 4.2% | 2.1% |
| UR5e | both | 14.6% (p<.001) | 14.6% | 37.5% | 2.1% |
| Panda | level | 2.1% (ns) | 2.1% | 10.4% | 2.1% |
| Panda | shape | 20.8% (p<.001) | 20.8% | 41.7% | 0.0% |
| Panda | both | 39.6% (p<.001) | 39.6% | 58.3% | 2.1% |
| iiwa14 | level | 0.0% (ns) | 0.0% | 0.0% | 0.0% |
| iiwa14 | shape | 6.2% (ns) | 6.2% | 4.2% | 2.1% |
| iiwa14 | both | 12.5% (p<.001) | 12.5% | 4.2% | 2.1% |
The parity argument: why correlation cannot substitute
Reverse a record end to end. A lag becomes a lead. Any statistic built from the joint distribution of simultaneous values is unchanged — reversal only permutes the samples. The Lévy area satisfies \(\mathcal{R}(\mathrm{levy}) = -\mathrm{levy}\) to \(4.7 \times 10^{-14}\). The vocabulary splits into an even sector (8 atoms) and a one-dimensional odd sector (1 atom).
A machine's defining multi-physics behaviour is a lag with a direction — torque heating a winding that then derates the torque. That lag is precisely the content of the odd sector. Every descriptor in the standard relational toolkit lives in the even sector.
What the atlas carries — and what it does not
| Target | Atlas R² | Marginals R² | Reading |
|---|---|---|---|
| Payload | 0.61 | 0.99 | Level property — atlas sees it weakly |
| Bearing friction | 0.36 | −5.49 | Atlas carries it; marginals diverge |
| Ambient temperature | −0.05 | 0.99 | Atlas is blind to workload |
| Duty cycle | 0.04 | 0.82 | Atlas is blind to workload |
What the atlas cannot do
-
Fails
Short-horizon forward prediction
Conditioning a pretrained model on the atlas code does not improve prediction error (0.168 vs 0.129 for no conditioning). Neither does conditioning on true physical parameters (0.160). The identity is redundant when the model already sees the state history.
-
Fails
Gas turbine drift separation
On 5 years of genuine asset ageing, the atlas centroid shift (0.819) was essentially the same as marginals (0.817). Recalibration and ageing are different things.
-
Scoped
Identifying distinct physical machines
On simulated fleets of genuinely distinct machines: 6–15% against 1.2% chance — indistinguishable from a per-channel baseline. What the real data supports is distinguishing operating episodes and machine kinds.
-
Design rule
Level faults (pump degradation)
For faults that shift absolute values rather than coupling geometry, per-channel marginals are the right tool. Atlas for relational faults, marginals for level faults, both when the fault regime is unknown.
Real drift: 200× less movement
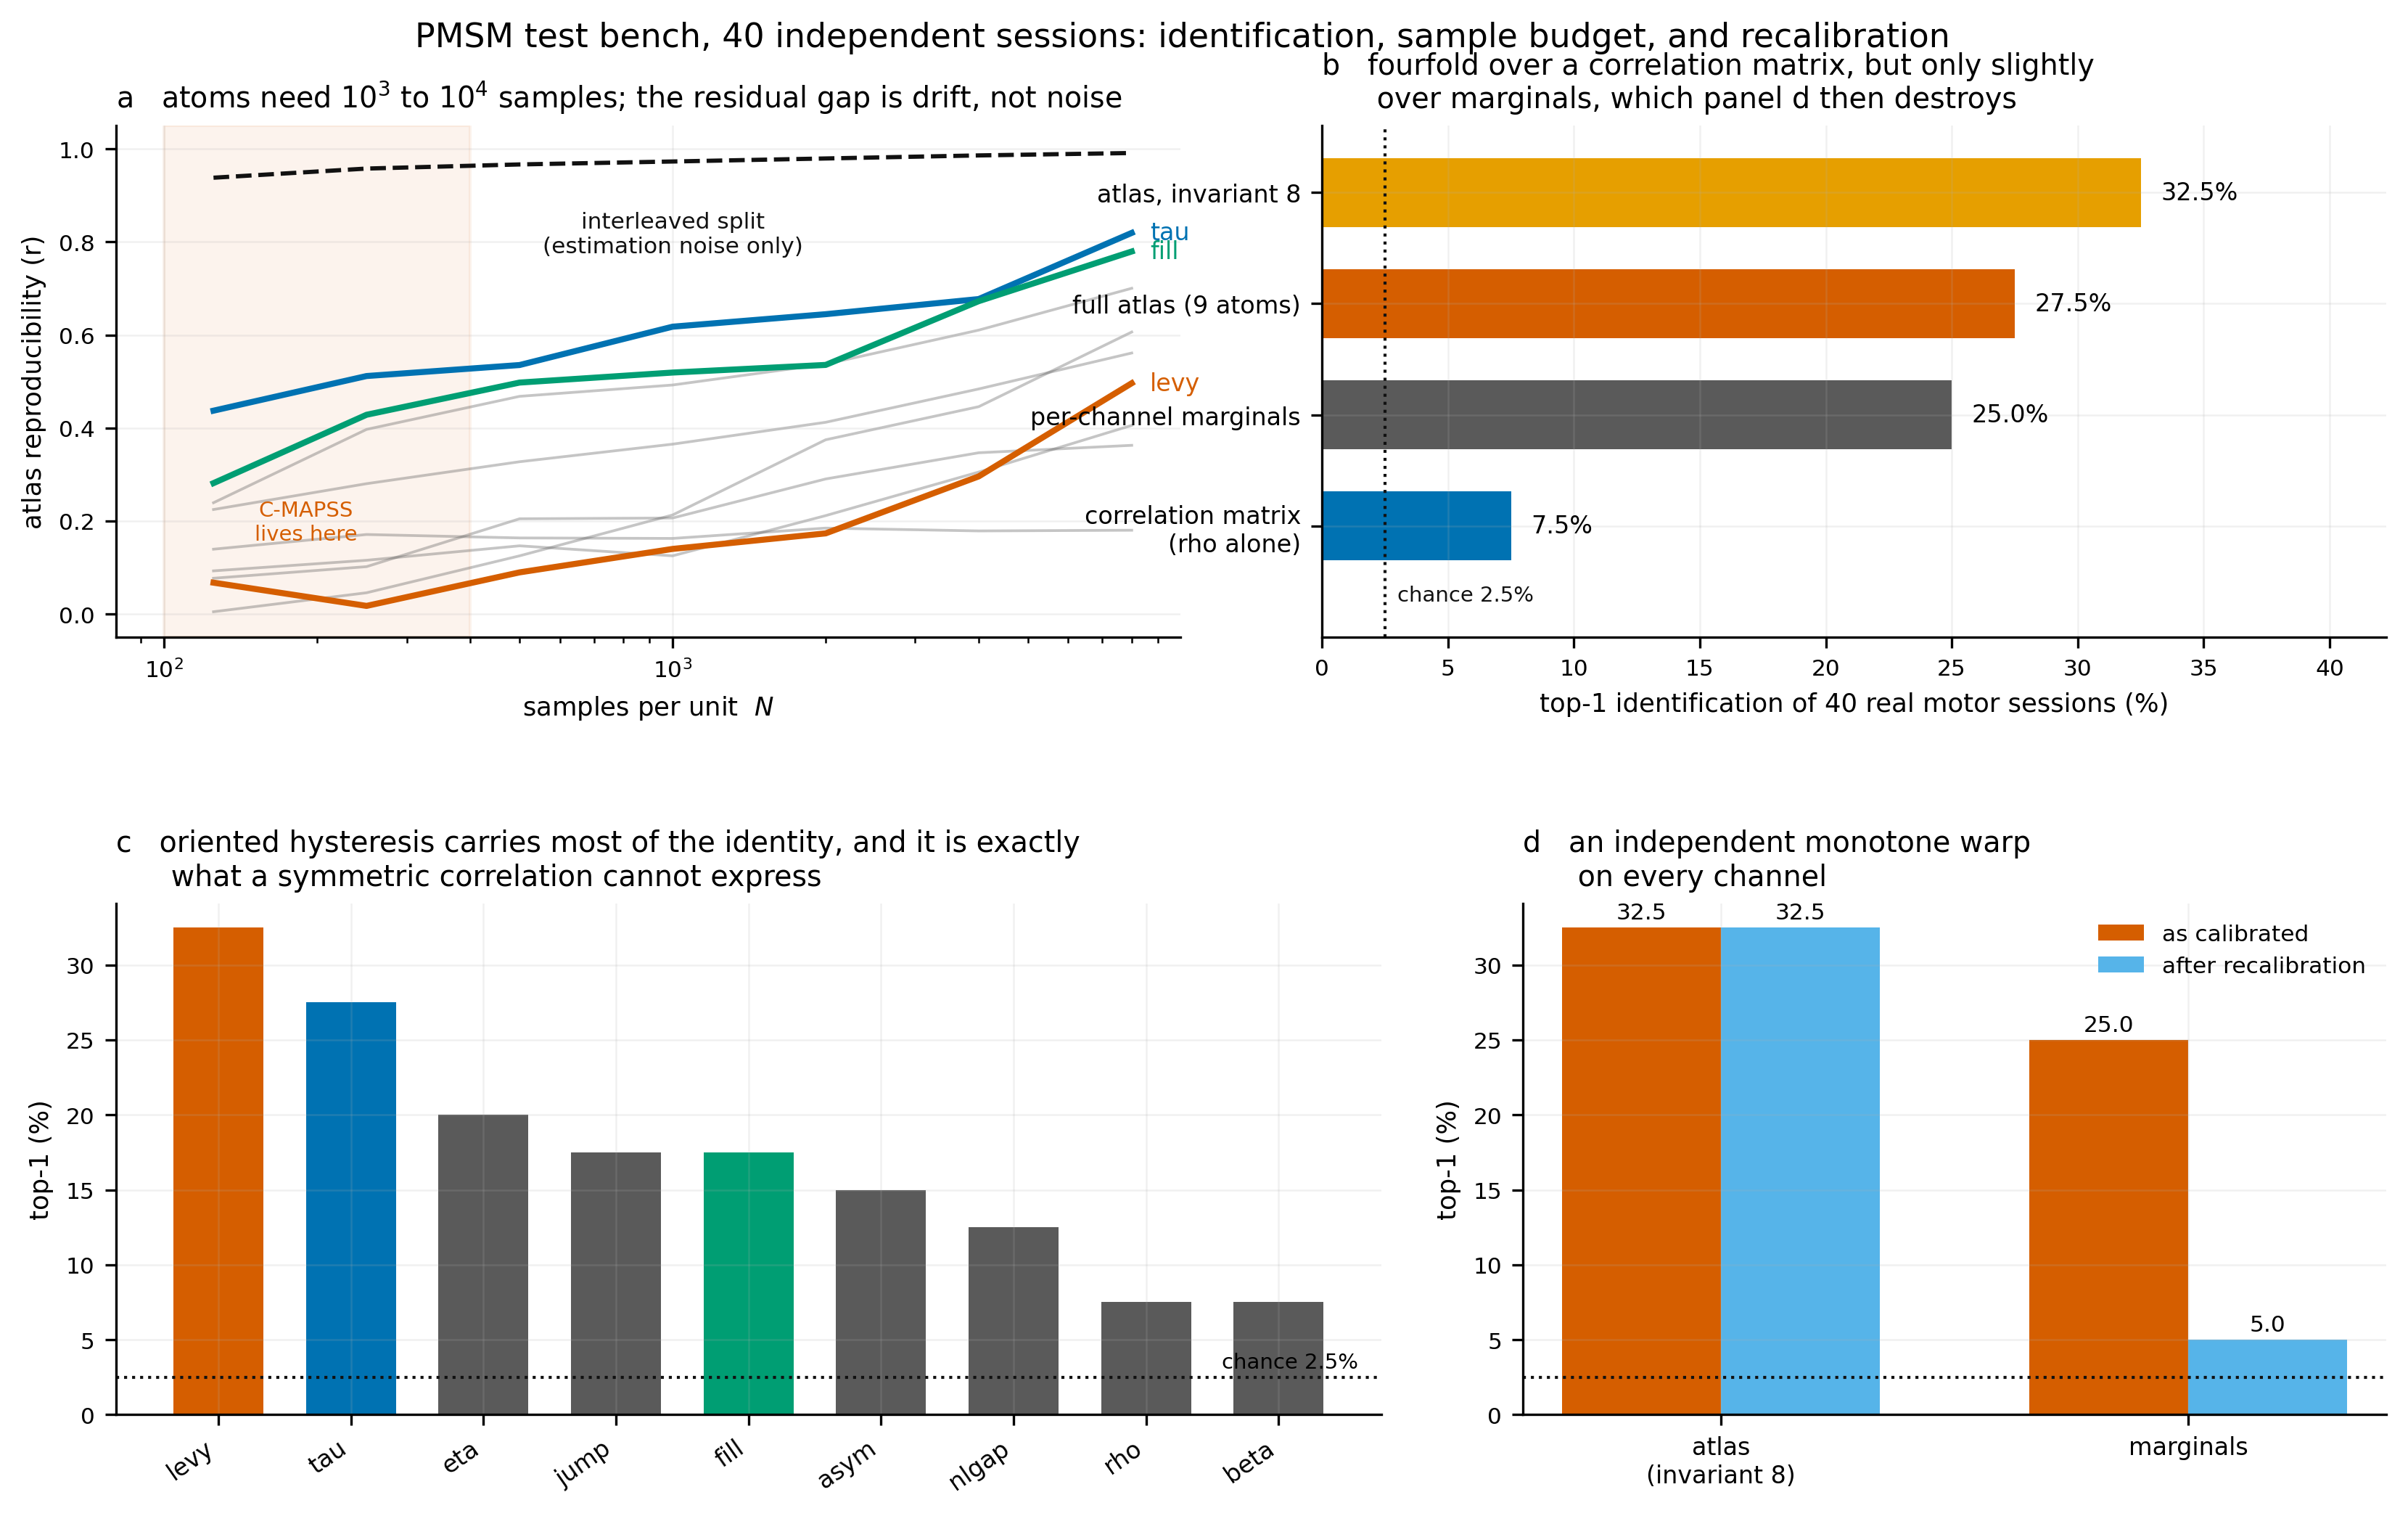
The PMSM bench has 69 sessions from one machine. Splitting into early (1–34) and late (35–69) gives a real sensor-ageing proxy without synthetic warps. The atlas centroid shifts 0.63 while marginals shift 126.3 — a 200× difference — yet both identify early vs late at the same accuracy (6.1%).
The atlas tracks relational physics while being immune to the magnitude drift that dominates the marginals.
Intrinsic dimension survey
| System | Regime | Channels | Live dim | d/n |
|---|---|---|---|---|
| Panda robot | closed, repeated | 14 | 3.19 | 0.23 |
| UR5e robot | closed, repeated | 10 | 2.28 | 0.23 |
| SKAB | closed, free | 10 | 2.28 | 0.23 |
| Hydraulic rig | closed, repeated | 14 | 3.55 | 0.25 |
| Transformer | closed, free | 14 | 5.36 | 0.38 |
| Gas turbine | closed, free | 11 | 4.26 | 0.39 |
| Steel plant | closed, free | 7 | 2.73 | 0.39 |
| Turbofan (sim) | closed, free | 24 | 9.45 | 0.39 |
| PMSM bench | open, rich | 12 | 5.72 | 0.48 |
| Wind farm | closed, free | 4 | 2.63 | 0.66 |
Reproduce
GitHub repo · Kaggle kernels · HF Space
git clone https://github.com/sehajr-singhs/operating-atlas
cd operating-atlas
pip install -r requirements.txt

# Generate atoms from a motor session
python -m atlas.atoms --input data/robot_ur5e.npz

# Run the 7-system benchmark on Kaggle
kaggle kernels push -p kaggle_kernel/ioo_real2

# Build the findings page
python atlas/build_page.py
All figures generated by matplotlib with Okabe-Ito colour-blind-safe palette at 300 DPI. Paper compiled with pdflatex (22 pages, 44 references, zero errors).